
We’ve already discussed how a lack of an effective test plan is one of the the major reasons why your implementations fail and discussed effective testing techniques so now it’s time to get into the nitty gritty and discuss testing techniques in detail. We’ll start off with Functional Testing which, whether you know it or not, is probably the testing technique you’re most familiar with.
Functional Testing
The test plan for functional testing should ideally be created at the same time and by the same person as the Business Requirements. In practice since the client or business department often provide the requirements this is unlikely to happen and any test plans which are provided are likely to be of insufficient depth. For this reason, it is crucial that you consider generating detailed functional unit test plans of your own. Generating the test plan when the requirements are first received can also be helpful in identifying any missing or ambiguous requirements.
Cause Effect Graphing
A useful technique is to draw out the possible branches in the code on paper as a Cause Effect Diagram to assist in identifying the test cases.
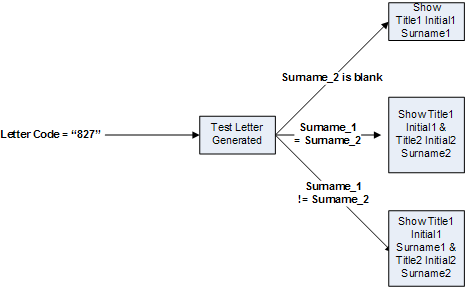
Consider a document from the top down. In this case letters generated by an insurance company regarding medical tests, one letter is sent to the clients doctor and another sent to the client(s). The first condition to consider is how is the document triggered? In this case we know (from the requirements) that it’s as a result of the letter code being equal to “827”, so start out by adding this to the diagram:-
![]()
The next break in the document is the first line of the recipients address. This is split depending on whether there is only one surname, two surnames that are the same, or two different surnames. With this in mind we can add the next level onto the diagram:-
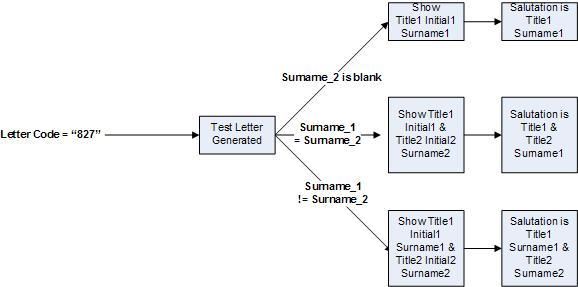
Following this is another check on the surnames for the salutation. However there are two separate rules, one if it is a letter to the doctor, another if it’s a letter the client. Whether it is a doctor letter or a client letter is identified from the recipient type field. If it is “10” or “11”, it is a client letter, if it is “1041”, “1042” or “1043”, it is a letter to the doctor. So we now need to add these branches.
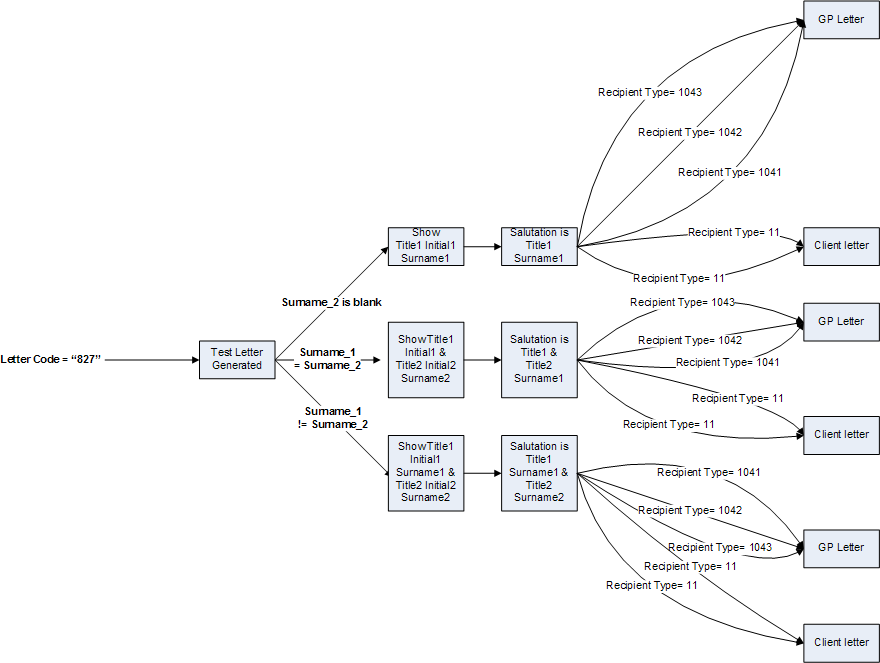
Looking at the chart now, an interesting point has come up. As the requirements stand, it’s perfectly possible for a doctor’s letter to be produced with two names on it. At this point the requirements should be clarified. How should it be handled if a request for a letter to a doctor arrives with two names? Should it raise an error? It may well be that there is processing in place upstream to ensure this doesn’t happen but it needs checking.
Assuming there is processing in place and that the client has told you that no functionality is required to handle this, then the diagram will now look like this:-
The next rule is the selection of the policy number. This rule says that if the recipient type is “10” then ” -10″ should be shown, if the recipient type is “11” then ” -11″ should be shown. If the recipient type is “1041”, “1042” or “1043” and the variable = then show ” -10″ and finally if the recipient type is “1041”, “1042” or “1043” and the variable = then show ” -11″. This expands the diagram to give the following:-
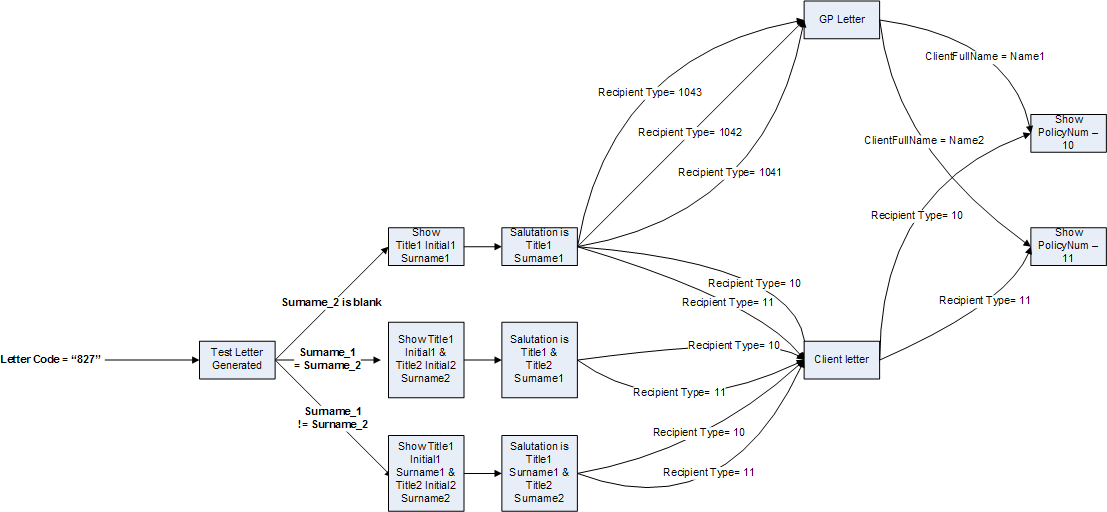
Obviously as you carry on through the document, the diagram grows in terms of complexity, and the final version will be much larger than this.
Once the diagram has been drawn you can trace each route through the diagram to generate your test cases.
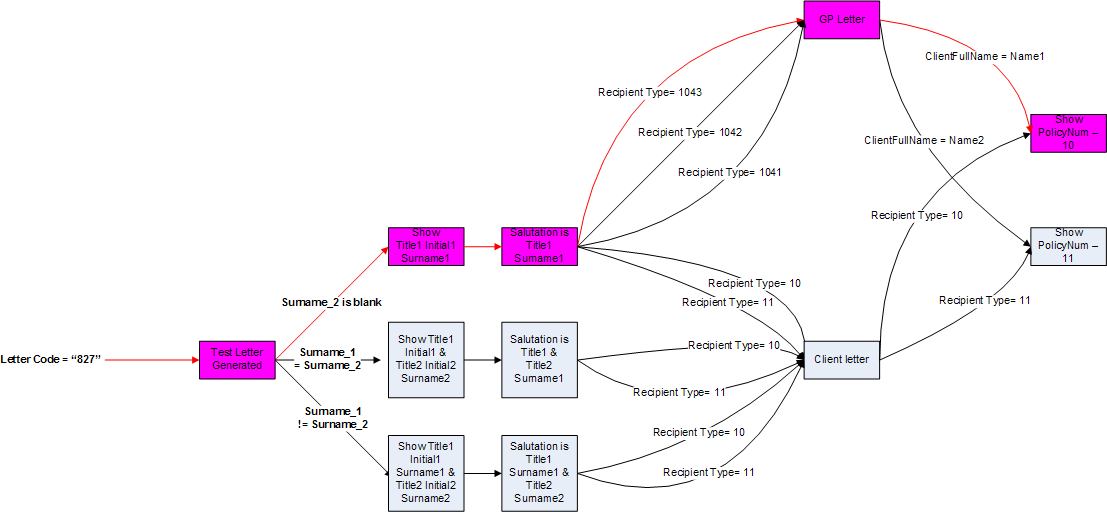
Tracing through the path highlighted in red gives the conditions for the first test case:-
- <lettercode></lettercode>= “827”
- <surname2></surname2> is blank
- <recipienttype></recipienttype> = “1043”
- <clientfullname></clientfullname> = <name1></name1>
As well as your expected outcomes highlighted in pink:-
- Test Letter Generated
- Address Line 1 Shows “Title1 Initial1 Surname1”
- Salutation is “Dear Title1 Surname1”
- GP Letter
- Policy Number 1 is printed
Tracing all possible routes gives the following test plan.
| No | Test Conditions | Expected Result |
| 1 | LetterCode = “827” Surname2 is blank Recipient Type 1043 ClientFullName = Name1 |
Test Letter Generated Address Line 1 Shows “Title1 Initial1 Surname1” Salutation is “Dear Title1 Surname1” GP Letter Policy Number 10 is printed |
| 2 | LetterCode = “827” Surname2 is blank Recipient Type 1043 ClientFullName = Name2 |
Test Letter Generated Address Line 1 Shows “Title1 Initial1 Surname1” Salutation is “Dear Title1 Surname1” GP Letter Policy Number 11 is printed |
| 3 | LetterCode = “827” Surname2 is blank Recipient Type 1042 ClientFullName = Name1 |
Test Letter Generated Address Line 1 Shows “Title1 Initial1 Surname1” Salutation is “Dear Title1 Surname1” GP Letter Policy Number 10 is printed |
| 4 | LetterCode = “827” Surname2 is blank Recipient Type 1042 ClientFullName = Name2 |
Test Letter Generated Address Line 1 Shows “Title1 Initial1 Surname1” Salutation is “Dear Title1 Surname1” GP Letter Policy Number 11 is printed |
| 5 | LetterCode = “827” Surname2 is blank Recipient Type 1041 ClientFullName = Name1 |
Test Letter Generated Address Line 1 Shows “Title1 Initial1 Surname1” Salutation is “Dear Title1 Surname1” GP Letter Policy Number 10 is printed |
| 6 | LetterCode = “827” Surname2 is blank Recipient Type 1041 ClientFullName = Name2 |
Test Letter Generated Address Line 1 Shows “Title1 Initial1 Surname1” Salutation is “Dear Title1 Surname1” GP Letter Policy Number 11 is printed |
| 7 | LetterCode = “827” Surname2 is blank Recipient Type 10 |
Test Letter Generated Address Line 1 Shows “Title1 Initial1 Surname1” Salutation is “Dear Title1 Surname1” Client Letter Policy Number 10 is printed |
| 8 | LetterCode = “827” Surname2 is blank Recipient Type 11 |
Test Letter Generated Address Line 1 Shows “Title1 Initial1 Surname1” Salutation is “Dear Title1 Surname1” Client Letter Policy Number 11 is printed |
| 9 | LetterCode = “827” Surname1 = Surname2 Recipient Type 10 |
Test Letter Generated Address Line 1 Shows “Title1 Initial1 & Title2 Initial2 Surname1” Salutation is “Dear Title1 & Title2 Surname1” Client Letter Policy Number 10 is printed |
| 10 | LetterCode = “827” Surname1 = Surname2 Recipient Type 11 |
Test Letter Generated Address Line 1 Shows “Title1 Initial1 & Title2 Initial2 Surname1” Salutation is “Dear Title1 & Title2 Surname1” Client Letter Policy Number 11 is printed |
| 11 | LetterCode = “827” Surname1 != Surname2 Recipient Type 10 |
Test Letter Generated Address Line 1 Shows “Title1 Initial1 Surname1 & Title2 Initial2 Surname1” Salutation is “Dear Title1 Surname1 & Title2 Surname2” Client Letter Policy Number 10 is printed |
| 12 | LetterCode = “827” Surname1 != Surname2 Recipient Type 11 |
Test Letter Generated Address Line 1 Shows “Title1 Initial1 Surname1 & Title2 Initial2 Surname1” Salutation is “Dear Title1 Surname1 & Title2 Surname2” Client Letter Policy Number 11 is printed |
Rationalising Test Plans
Looking at the test plan so far, you can see that even for a relatively simple system, with only three levels of conditioning, we’ve already got twelve different tests to run. In practice, real documents are likely to have much more complexity than shown in the example above, and therefore are going to require an exponentially larger number of test cases.
Although testing is always a monotonous, repetitive task it is possible to reduce the amount of test cases required by eliminating some of the duplication. The test plan above shows the complete set of test cases required in order to be 100% certain that the requirements as stated are working, however in reality, you are unlikely to have enough time to be able to completely unit test an application to 100% certainty.
This is the point where Unit Testing becomes more of an art form than an exact science. It is unrealistic to expect to be able to eliminate 100% of any bugs through unit testing. It would simply become too expensive and time consuming. The aim of unit testing is to eliminate as many of the bugs as possible in the shortest possible time, therefore the challenge of a test plan is to design test cases that give the most “bang for your buck”. Test cases should test as many conditions as possible in as low a number of test cases as is reasonable.
With this in mind, you can start looking at the test cases to identify duplicate tests, or rather equivalent tests.
Looking back at the above example, we can see that the only difference between test case #1 and test case #2 is that one displays policy number 10 and the other displays policy number 11. This same difference exists between #3 and #4 and also between #5 and #6. It would be a reasonable assumption to say that if #1, #2, #3 and #5 produce correct results, then the chances are that #4 and #6 will produce the correct result. Therefore test cases #4 and #6 can be removed from the plan. Similarly if test cases #7, #8, #9 and #11 produce the expected result, then it is likely that test cases #10 and #12 will produce the correct result. This means that there is little to gain from running the test cases #4, #6, #10 and #12 compare the effort required in running them. It may therefore be sensible to drop them from the test plan. This reduces the number of test cases, from twelve to eight.
The reduction in required test cases is largely dependent on how interdependent the various conditions are. If there is a lot of dependency between elements then the overlap between conditions will be low whereas if all the conditions are unrelated then a lot more rationalisation will be possible.
It should be also be noted that in reducing the number of tests, you are effectively reducing the coverage of your testing. With this in mind, care should be taken to only eliminate tests where the results can be safely assumed from the results of other tests. E.g. in the above example although test cases #1, #3 and #5 are very similar, it would be unwise to eliminate tests #3 and #5 if #4 and #6 have already been dropped as they are testing different values for the recipient type.
Clean vs Dirty Testing
One final thing to note is that the above example only deals with Clean Testing, i.e. testing valid scenarios. It is usually a good idea to include some Dirty Testing, i.e. testing what happens when invalid data is supplied, even if the requirements do not explicitly ask for error handling. What is your application going to do if it is sent bad data? Will it skip the document in question? Will it fall over and stop the whole application? Even worse, will it carry on as if nothing has happened? Some errors will inevitably occur in data and it if you already know what will happen in particular error situations then it is easier to take remedial action.
Boundary Analysis
Consider the the conditions shown below:-
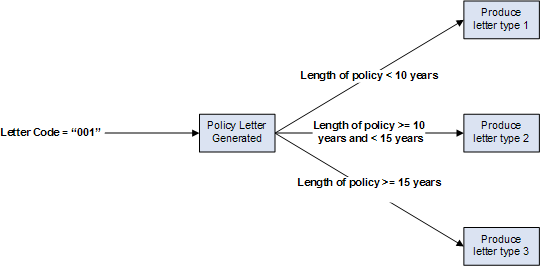
This is known as a boundary condition since the rules are dependent on boundary values for a selected variable. If we take the approach that we need to test all potential values for a variable, we would be here for a very long time, as there may be an almost limitless range of possible values for the variable “Policy Length”. Clearly this would be impractical to test and so a better approach is required.
For conditioning like this, the most probable errors will be around the variable boundaries. For example, coding:-
IF variable < value then…
instead of
IF variable <= value then
the most effective method of testing is therefore to test what happens at these boundaries. in the above example, the following would be a good start:-
| No | Test Conditions | Expected Result |
| 1 | Policy Length = 1 | Letter type 1 |
| 2 | Policy Length = 9 | Letter type 1 |
| 3 | Policy Length = 10 | Letter Type 2 |
| 4 | Policy Length = 11 | Letter Type 2 |
| 5 | Policy Length = 14 | Letter Type 2 |
| 6 | Policy Length = 15 | Letter Type 3 |
| 7 | Policy Length = 16 | Letter Type 3 |
In addition it is worth including some values outside the valid range, as discussed above e.g.
| No | Test Conditions | Expected Result |
| 8 | Policy Length = 0 | ?? |
| 9 | Policy Length = -1 | ?? |
Spreadsheets As A Testing Tool
Cause Effect graphing is a very useful technique for designing test plans, however it doesn’t suit every application. In the example above, different branches were triggered by different sets of variables, i.e. the salutation was based on the values in the name field, The type of letter was based upon the recipient type field etc. This type of application is perfect for Cause Effect graphing as each branch effectively limits the number of branches that can be triggered in subsequent branches.
Unfortunately, not all applications are designed this way. Consider the following Cause Effect diagram for a letter:-
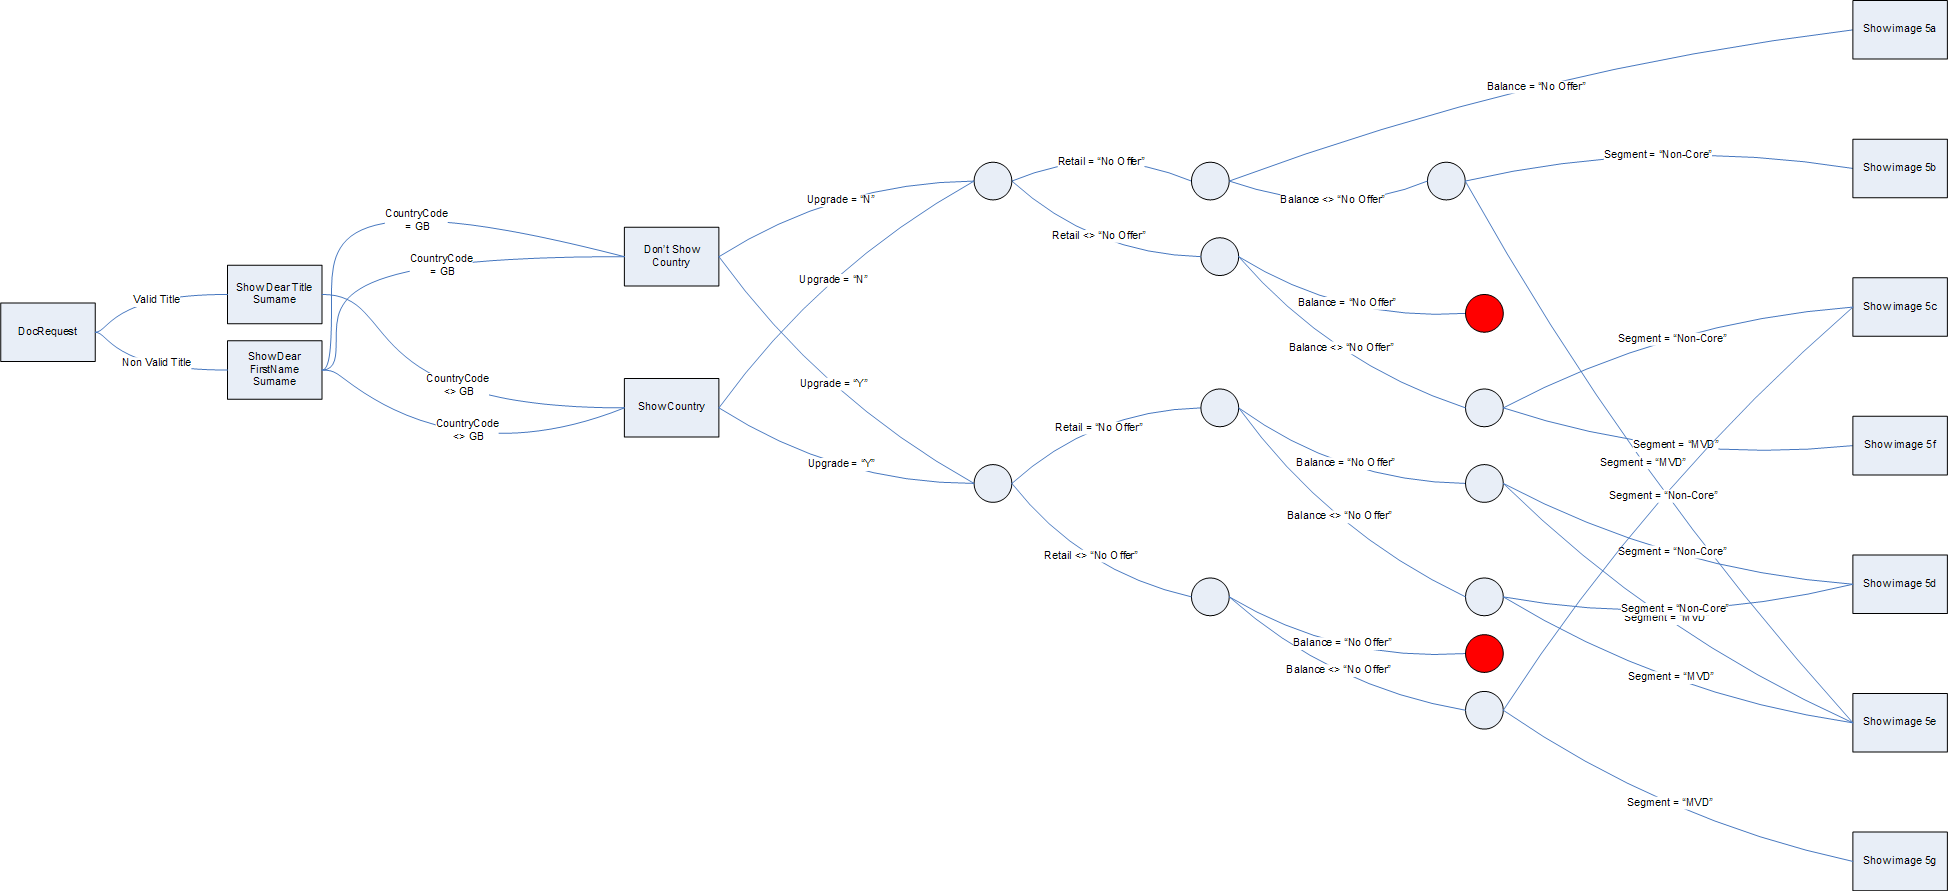
This Diagram only shows the first few decision branches and is already considerably more complex than the previous example. Carrying on and adding further levels would quickly get the diagram to the point where it becomes unmanageable. This is largely due to the fact that virtually all conditioning in the document is based around various combinations of the same eleven variables in various combinations. There are still advantages to creating Cause Effect diagrams, for instance in the above example, the nodes highlighted in red show combinations where no requirement has been specified. This could be a prompt to go back to the client to check if this is valid. However for test plan purposes there are going to be so many paths through the application that generating test cases from the diagram is going to be a very painful process. In this case it can be useful to turn to a spreadsheet tool such as Microsft Excel for designing your test cases.
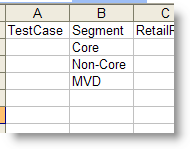
Start by entering the variables across the top of the page as column headings:-
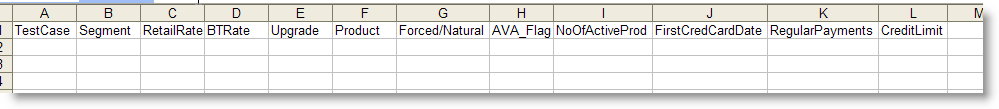
For the first variable column, add the possible values:-
Now in the next column, add the first value for the next variable, against each of these values:-
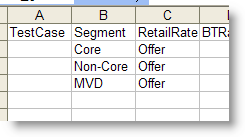
Then copy the values from the first variable (segment) below, and add the next value in the second variable (RetailRate):-

Continue doing this across the other variables, and you will eventually end up with a list of all possible combinations of the variables:-

You can then add in a column for the first set of conditions. Using the AutoFilter feature it is then possible to limit the test cases displayed to those that qualify for the first rule:-

You can then continue adding the remaining cases for the each set of rule, and you will eventually end up with a complete set of test cases and expected results. This set can then be rationalised to give a workable test plan. You can also use the Autofilter feature to identify any cases that don’t have a component identified for a particular set of conditions which should then be clarified with the client.
There has been a lot more information than usual in this post and it’s a lot to take in at once so why not bookmark this page and come back to it later. Next we’ll look at structural testing and other things to consider when planning your testing.